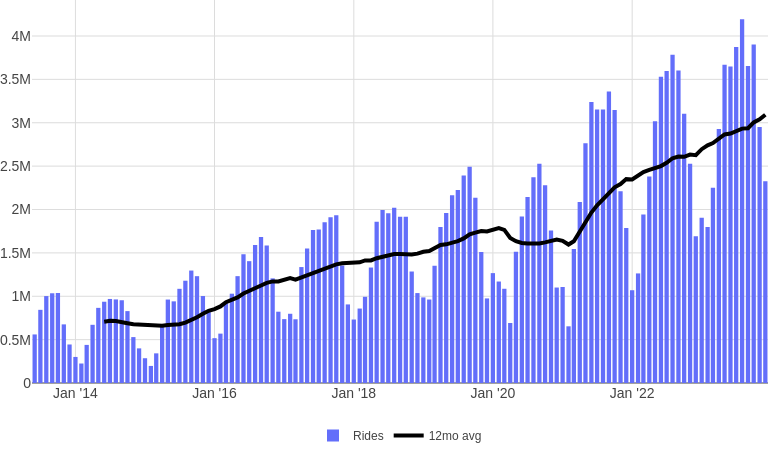
Citi Bike Rides per Month
⚙️
Region
Stack by
Y Axis
User Type
Gender
Bike Type
Expand the "⚙️" to filter or stack by region, user type, gender, bike type, or date, or toggle aggregation of rides or total ride minutes.
Examples
- JC + Hoboken (stacked)
- Ride minute %'s, Men vs. Women, Jun '14 – Jan '21
- Annual vs. daily user %'s
- Classic / E-bike ride minutes (stacked)
- Default view (system-wide rides over time)
This plot refreshes when new data is published by Citi Bike (typically the 1st or 2nd week of each month, covering the previous month).
The GitHub repo has more info as well as planned enhancements. Data updates are performed by Github Actions.
Map: Stations + Common Destinations
Tap a station to see where rides originating there go:
(Full screen version)🚧 Data-quality issues 🚧
Several things changed in February 2021 (presumably as part of the Lyft acquisition):
- "Gender" information is no longer provided:
- All rides are labeled "unknown" starting February 2021
- Here's an example showing the available data
- JC/HOB e-bike data only begins in Feb '21 (vs. Jan '20 for NYC) (example)
- The "User Type" values changed ("Annual" → "member", "Daily" → "casual"); I'm using the former/old values here, they seem equivalent.